blockhill - forest garden experience & education
North Canterbury
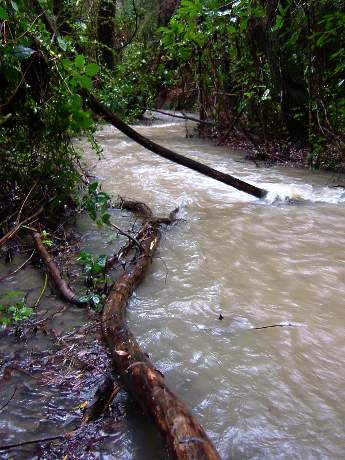
The weather men predicted this one and issued dire warnings. We are well placed (elevated) to deal with torrential rainfall... just a bugger about the leak in the roof, I thought I'd fixed it.
Other wet weather news
May 26, 2010
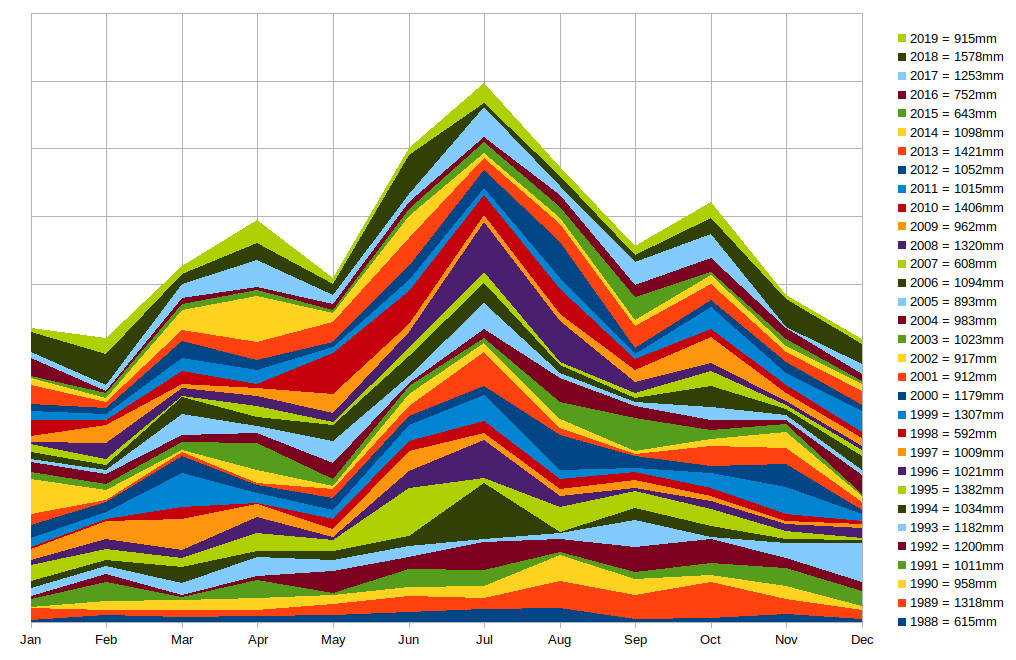
Visualising yearly rainfall distribution
This chart shows annual rainfall by month for the years 1990 - 2014 (and partial 2015). While there is a definite tenancy for rain to occur in June and July there is also obvious bumps in October, March and April. Wider areas of colour represent times of high rainfall while narrow regions are dryer.
It becomes clear that rainfall can occur at any time throughout the year and that dry years follow periods high rainfall. With this in mind it makes a lot of sense to be approaching water catchment and management with a multi year view of charging up soil moisture during wet times to carry us through periods of below average rainfall.
Data obtained from NIWA Ferniherst dataset
September 20, 2015